Analysis & Results
The primary focus of our project was designing a feature set that would be suitable for the task. We wanted to capture the sonic components of a song in such a way that they would be individually discernable, but still have a low dimensionality. The idea was that songs of a certain genre would share some pitch information based on the instruments used, and that from this information alone a model could be built for classification. In addition, we wished to see how unique the pitch features were to the artists sampled and build a artist classifier.
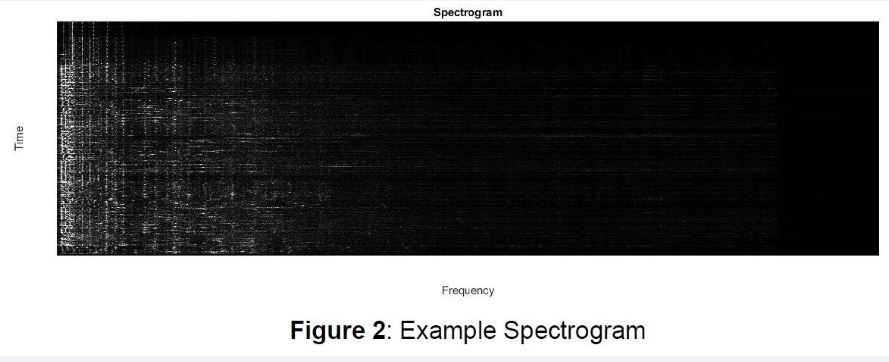
We initially thought that the spectrum of a song would be a useful feature because it contains of all relevant frequency information. However, after visualizing some spectra, we found that the features were too sparse. For example, the majority of the frequency content exists within 2 kHz whereas the spectrum range is well above 10 kHz (Figure 1, blue line). Another representation for audio frequencies is the spectrogram, which is an image where the y-axis represents time, and the x-axis represents frequency. The intensity of the pixels represents the power in the frequency band. Just like the spectrum, the spectrogram has the issue of sparsity wherein the majority of entries are zero. This is problematic because the unhelpful entries (dark pixels) outweigh the helpful entries (light pixels) (Figure 2).
We initially thought that the spectrum of a song would be a useful feature because it contains of all relevant frequency information. However, after visualizing some spectra, we found that the features were too sparse. For example, the majority of the frequency content exists within 2 kHz whereas the spectrum range is well above 10 kHz (Figure 1, blue line). Another representation for audio frequencies is the spectrogram, which is an image where the y-axis represents time, and the x-axis represents frequency. The intensity of the pixels represents the power in the frequency band. Just like the spectrum, the spectrogram has the issue of sparsity wherein the majority of entries are zero. This is problematic because the unhelpful entries (dark pixels) outweigh the helpful entries (light pixels) (Figure 2).

|
|
Having exhausted possibilities for this approach, we decided to use LPC coefficients to build our main feature set. LPC coefficients are often used in speech processing applications because they can represent the spectral envelope of a signal in a compressed form. In Figure 1, one can see that the reconstructed spectrum found using LPC coefficients roughly follows the shape of the original spectrum. Because the number of LPC coefficients is much less than the number of points in the audio spectrum (100 vs. ~10,000), we solved the sparsity problem while
maintaining all the necessary audio information. In conclusion, we transform a song into a series
of LPC coefficients.
Our next task was to find out which parts of the song are most important for the model building and classification. One would expect the beginning and end of a song to contain features that are less informative compared to the rest of the song. We inferred this due to the fact that intros can have a slower start and a different set of instruments, and endings may fade out and therefore be too quiet for yielding robust features. We decided to use only the portion of a song between 10% and 90% of its length. This modification had less than a 1% change in performance.
We began by extracting 32 equidistant portions of each song that were 1 second in length. After testing various lengths (ranging from 0.5 to 2.25 seconds) we found that the 2 second features somewhat improved the accuracy (by about 5%, see Table 1). Evidently, the model is sensitive to the duration of audio portions. We believe this could be due to the fact that very short portions of audio are not sufficient in capturing enough pitch information, whether for instrument discernment or for recognizing the singer’s voice. In essence, longer portions of audio are necessary to acquire information regarding the timbre of the song. On the other hand, it is also unhelpful to use audio portions with very long durations because the frequencies of the composite instruments and vocals will be muddled.
In this manner, we also tried using less audio portions in the feature set (see Table 2) while maintaining 2 second portion sizes. Once again, it is clear that the accuracy was not greatly impacted by the changes in both the artist and genre classifications. This is particularly interesting because it suggests that our algorithm makes similar decisions regardless of whether the duration of input audio is 2 seconds or 64 seconds long. This is somewhat counter-intuitive given that human performance on these tasks will change dramatically with this disparity in length.
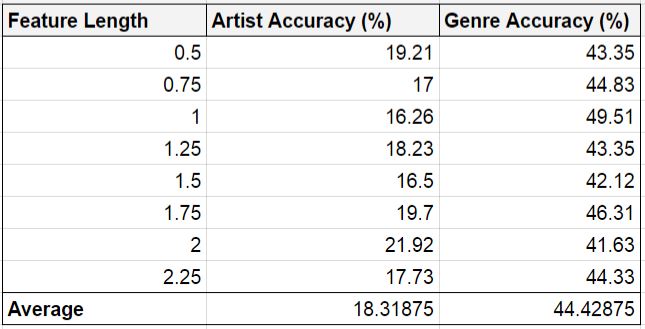
Table 1
|
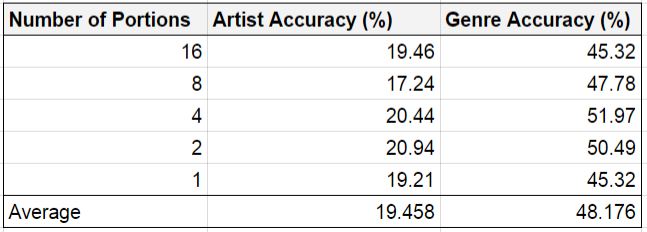
Table 2
|
To see exactly how well a person could perform on these kinds of tests, we decided to set up a short song classification procedure for the members in our group. In attempt to replicate how the algorithm receives input, we played 10 one-second portions of a song and then attempted to guess both the artist and the genre. Since no individual group member had heard all the songs in our data set, we decided to take the test in teams of two. We had our third teammate act as a proctor, choosing songs at random and recording our responses, for a total of 10 songs per round for three rounds. We rotated the role of proctor so each person took the test two times. Overall, our accuracy for genre classification was 93% and our accuracy for artist classification was 56% (see Figure 3). Clearly, humans are not perfect at this task either, but our algorithm is insufficient as well. This suggests that these audio features must be paired with more features to achieve human-level accuracy or higher. Further work could involve combining these features with other features such as user preferences on streaming sites. Even changing the model entirely from SVM to another learner could be useful.

Figure 3: Each group tried to classify the artist and the genre of 10 random songs, given that they were able to listen to several 1 second pieces.
The breakdown of work contributions for the project is:
Gale: Website layout & design, creating user artist recognition game for website, participating in human trial, taking part in data collection, and generating LPC features.
Arjun: Implementing spectrum, spectrogram, and LPC feature extraction code; implementation of feature testing and classifier generation code; extracting some of the feature sets; testing using different feature lengths; participating in human trial; collecting all rock songs in database.
Roman: Generation of LPC features, and generation and study of crossover matrices. Finding trends in classification models and data to improve accuracy using Weka. Taking part in data collection and experimentation in trial among group members.
